
.png)
Azimuth (RRID:SCR_021084) is a web application that uses annotated reference dataset to automate processing, analysis, and interpretation of new single cell RNA-seq experiment. Azimuth leverages reference-based mapping, a pipeline that inputs a counts matrix of gene expression in single cells, and performs normalization, visualization, cell annotation, and differential expression. All results can be explored within the app, and easily downloaded for additional downstream analysis.
Access Azimuth here:
https://azimuth.hubmapconsortium.org/
Described in paper by Hao et al. 2021.
.jpg)
Brain Architecture (RRID:SCR_004283). The Brain Architecture portal, active since 2012, provides a virtual microscopic brain observatory spanning multiple species, including mouse, marmoset, human and zebrafinch, and data analysis tools. The project is creating mesoscale brain connectivity maps for the mouse and the marmoset. A peta-voxel data set, with thousands of brains injected with neuronal tracers to help visualize the mesoscale connectivity, are interactively viewable. Spatial distributions of specific cell types, histological reference brains and atlases across species are also presented.
Access Brain Architecture here:
http://brainarchitecture.org/
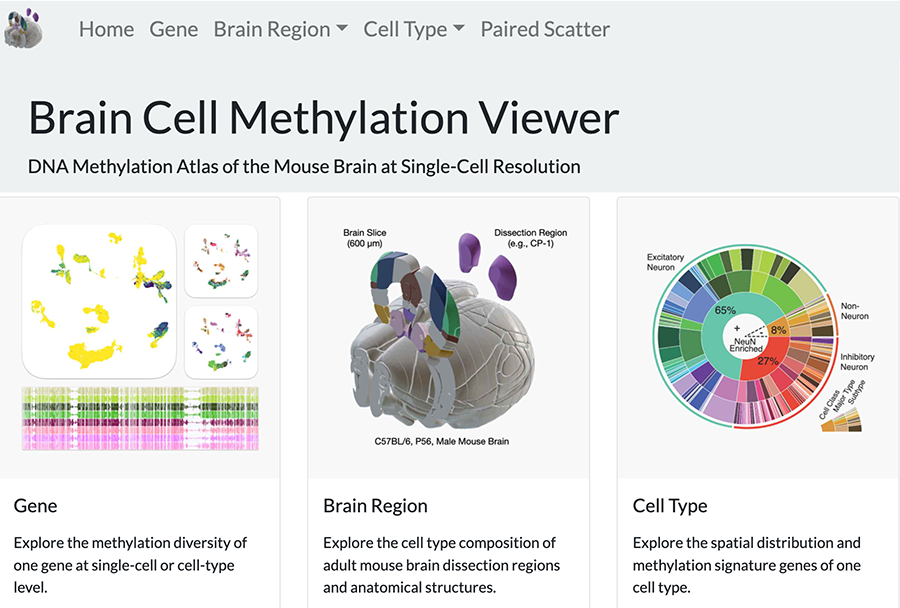
Brain Cell Methylation Viewer (RRID:SCR_020954). Viewer for DNA Methylation Atlas of Mouse Brain at Single Cell Resolution. Browser to interactively explore single-cell methylome dataset including exploration of methylation diversity of one gene at single-cell or cell-type level, exploration of cell type composition of adult mouse brain dissection regions and anatomical structures, exploration of spatial distribution and methylation signature genes of one cell type.
Access Brainome Portal here:
http://neomorph.salk.edu/omb
Ecker Lab (https://ecker.salk.edu/), Salk Institute for Biological Studies
Described in paper by Liu et al. 2021.
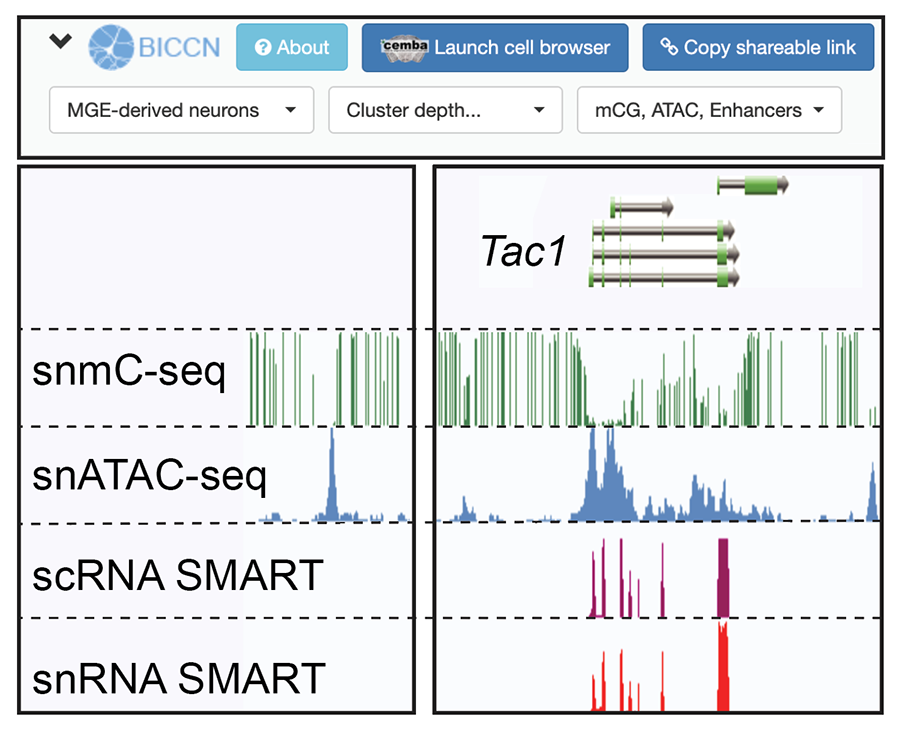
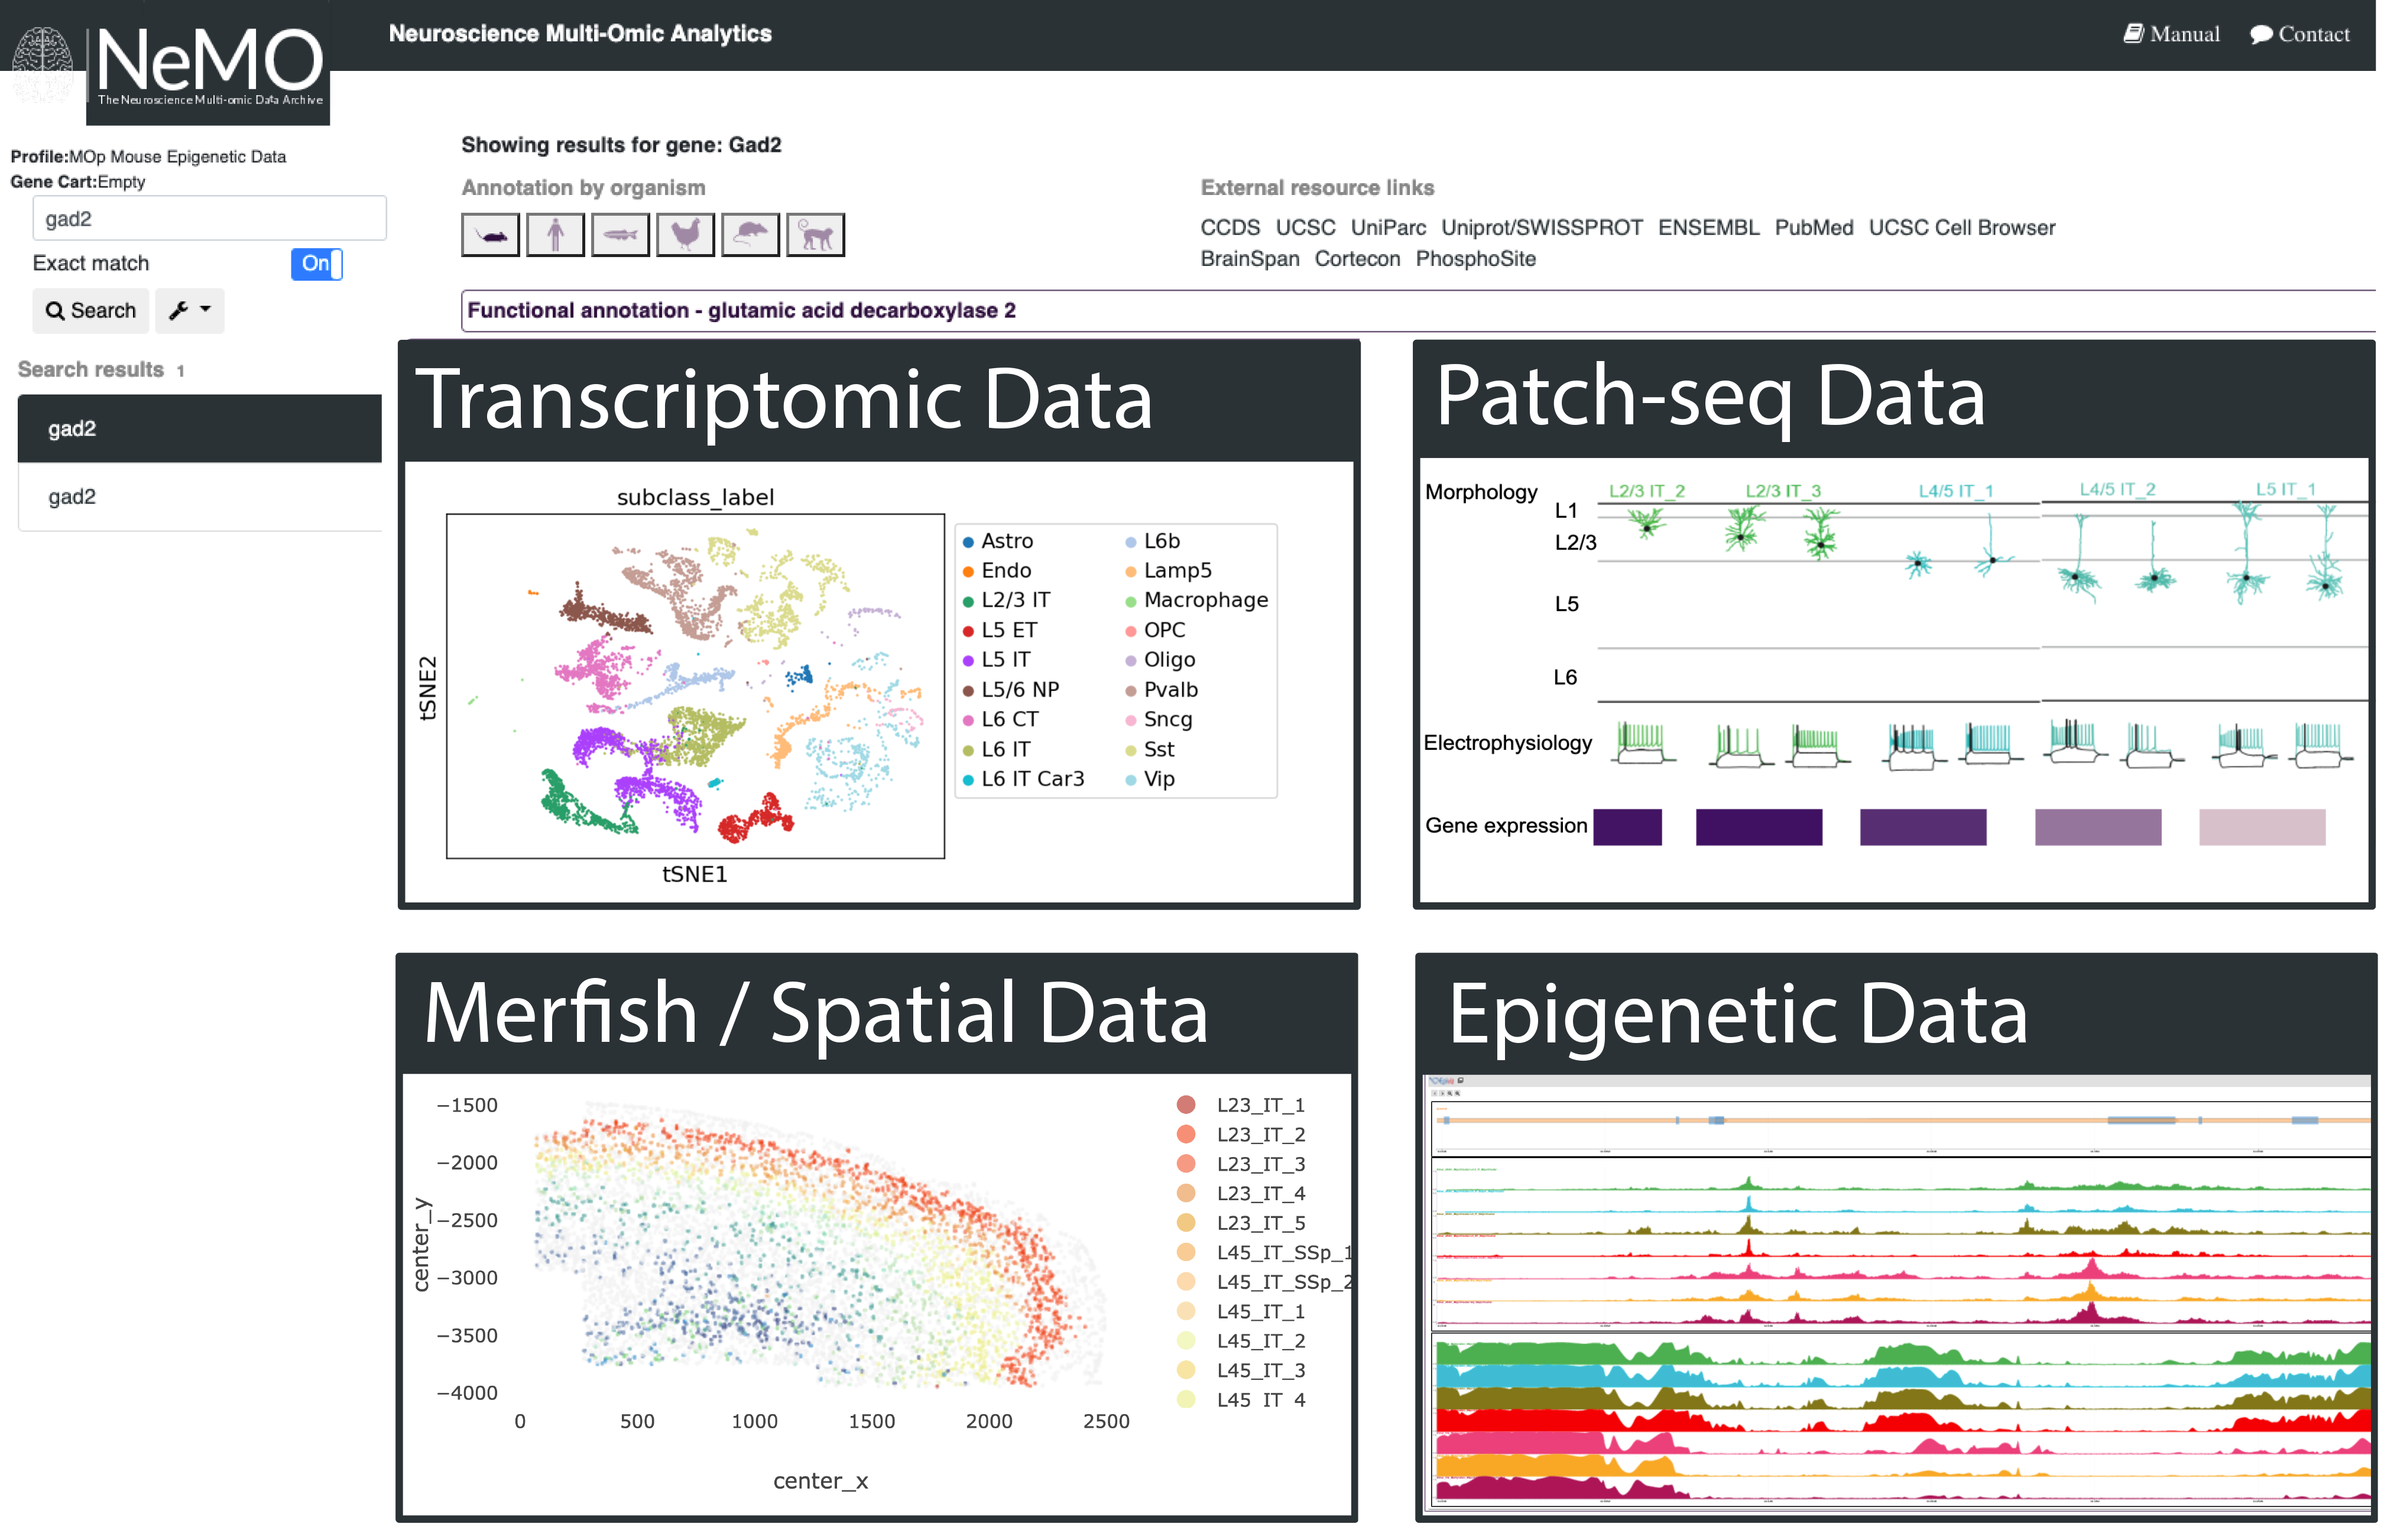
Brainome Portal (RRID:SCR_018162). Genome browser viewer for single cell epigenomic and transcriptomic data (DNA methylation, ATAC-seq, RNA-seq) from mouse primary motor cortex. Search for genes to visualize genomic loci, including enhancers marked by peaks of chromatin accessibility and low DNA methylation.
Access Brainome Portal here:
https://brainome.ucsd.edu/annoj/BICCN_MOp/
Described in paper by Yao et al. 2021.
Mukamel Lab (https://brainome.ucsd.edu), UCSD Cognitive Science
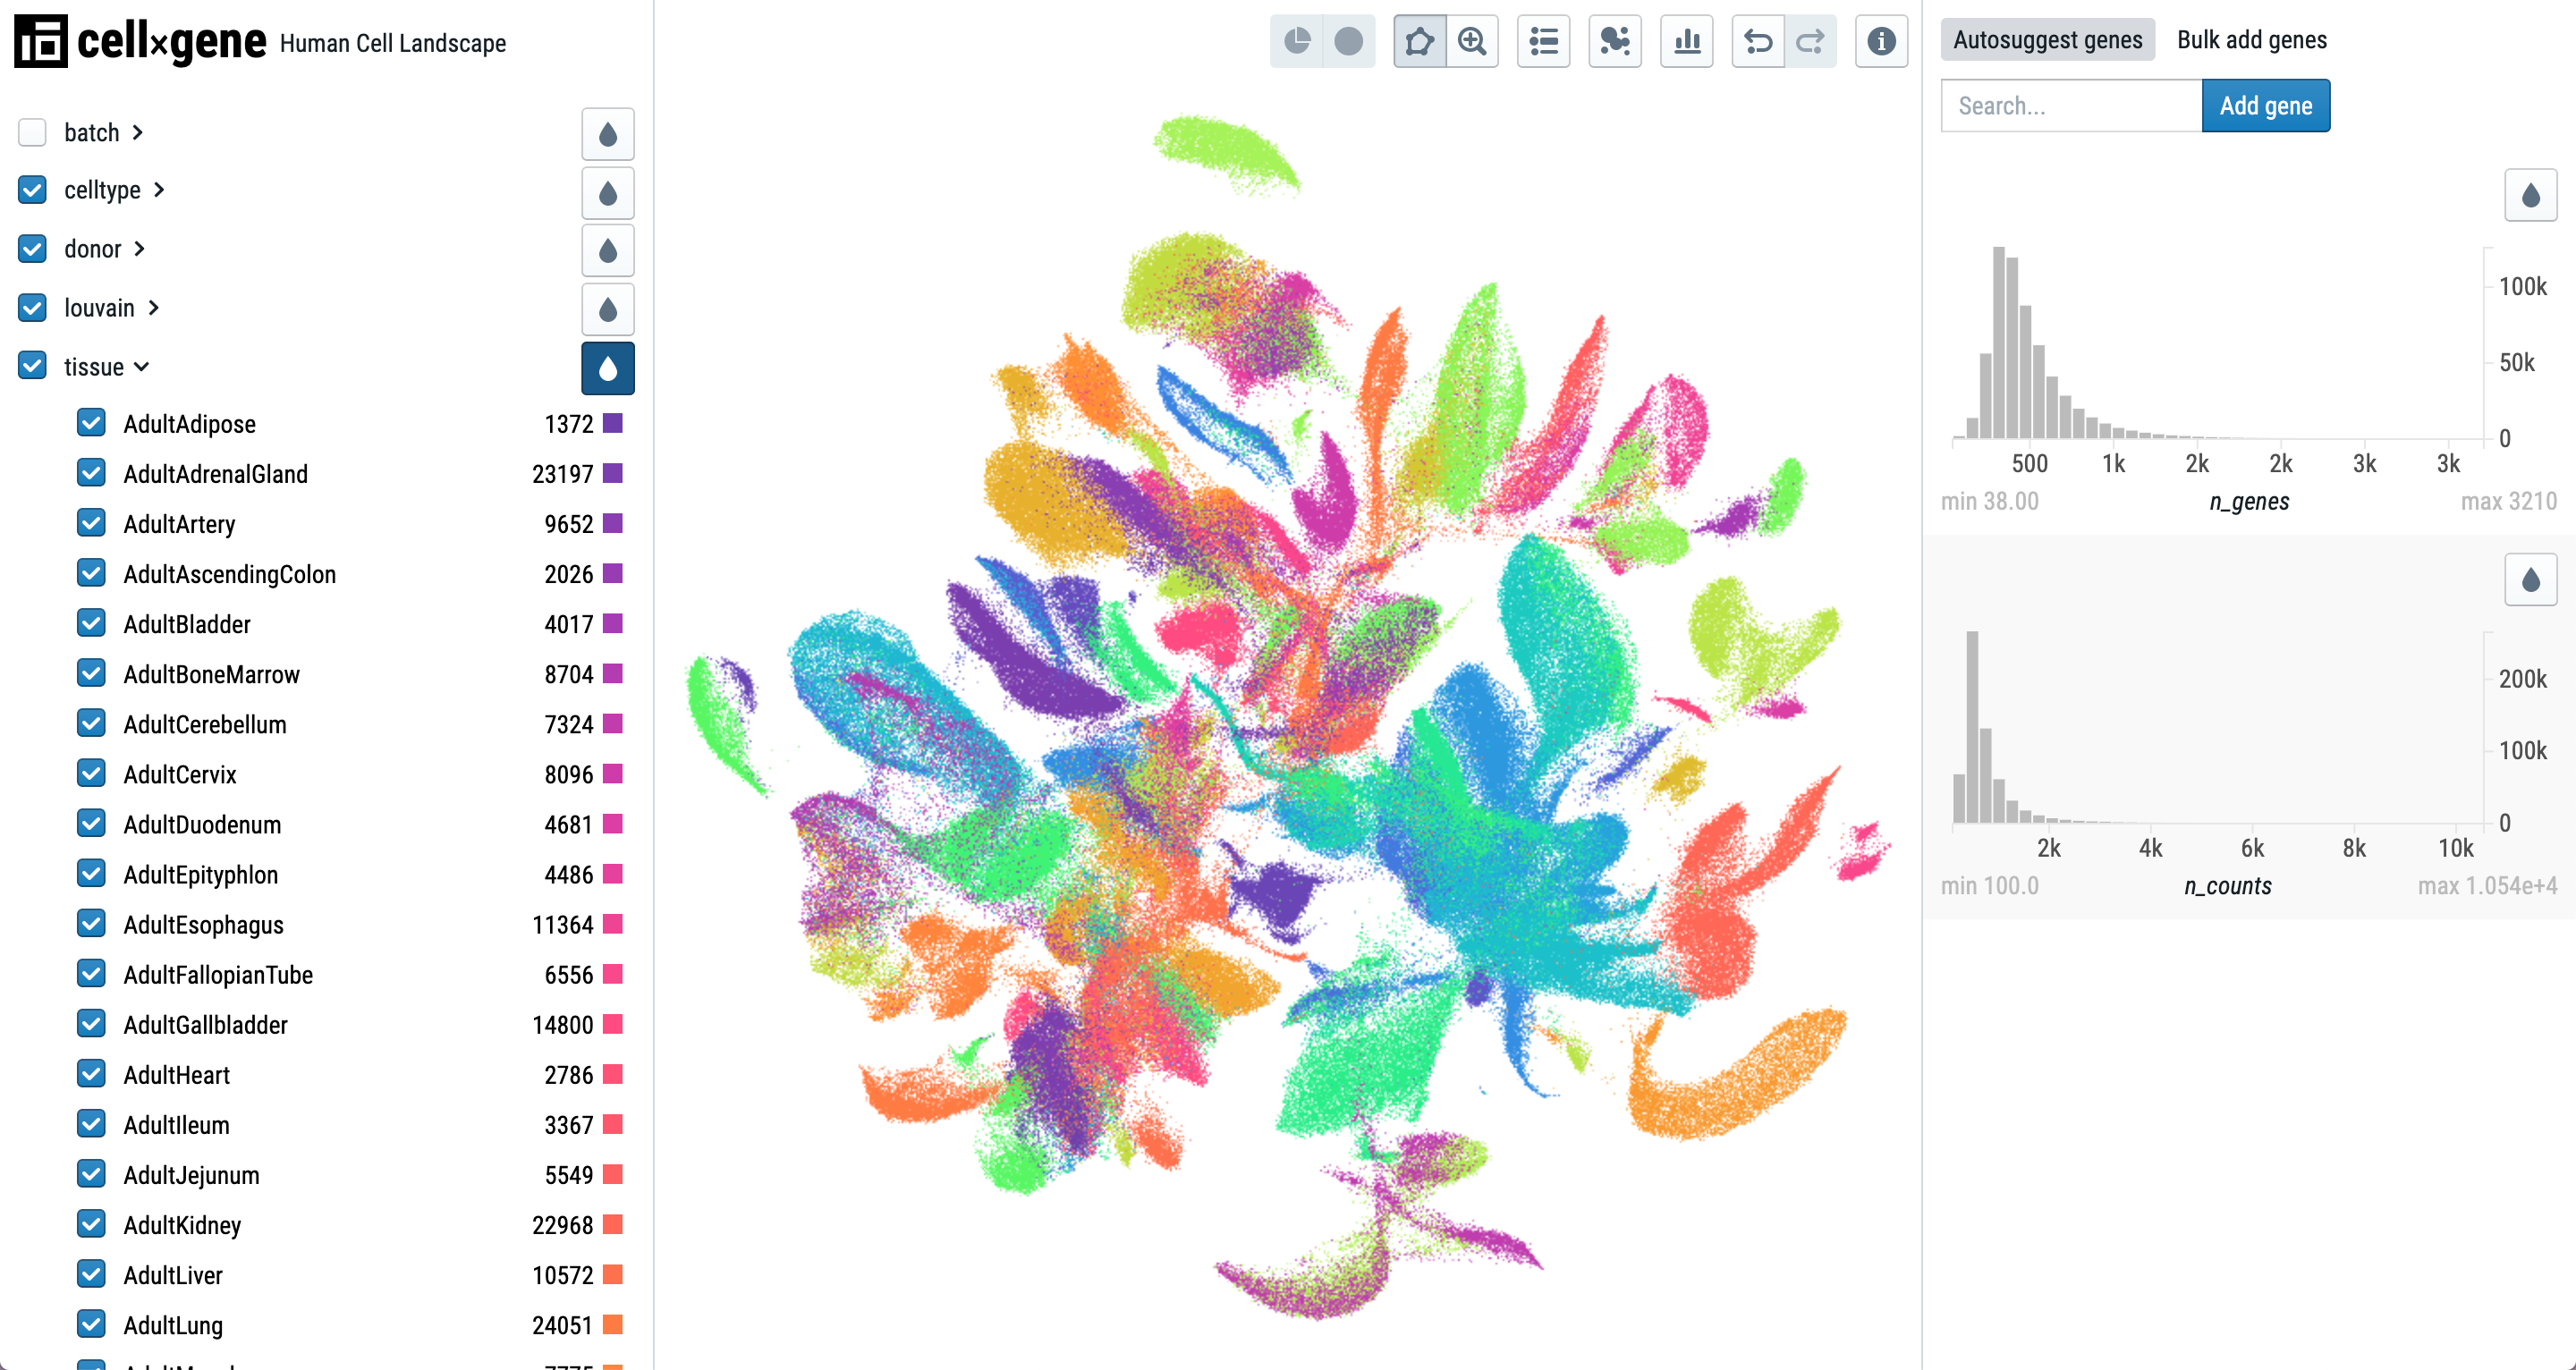
cellxgene (RRID:SCR_021059) Created by the Chan Zuckerberg Initiative, cellxgene is a scalable, open source resource designed to make it easier for researchers without computational experience to easily share and explore single-cell datasets from various modalities in common formats. Users can visualize gene expression at the level of an entire dataset, or particular subset of cells to help identify cell types, which in turn can help identify diseases. Cellxgene enables plotting gene expression levels, or other features, against another gene to compare how these different genes are expressed across a dataset, and it integrates with existing tools like SciPy and Jupyter.
Access cellxgene here:
https://cellxgene.cziscience.com/
Described in paper by Megill et al. 2021.
Chan Zuckerberg Initiative (https://chanzuckerberg.com/science/programs-resources/single-cell-biology/cellxgene/)
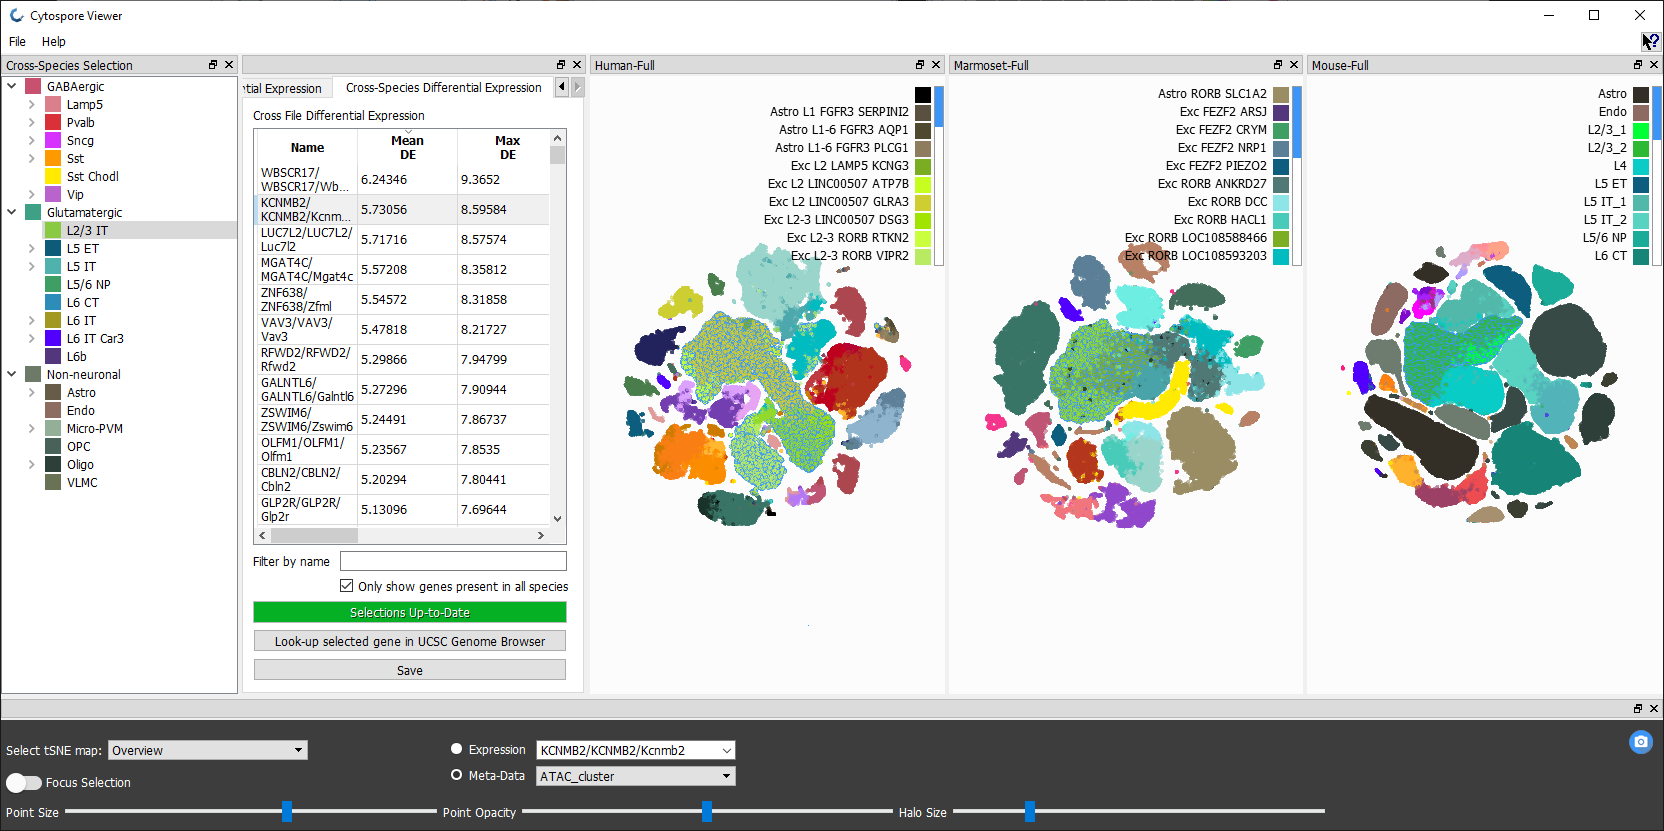
Cytosplore Viewer (RRID:SCR_018330) is an interactive visual analysis application (Windows and MacOS) for exploration of multi-species and cross-omics single cell data published in Allen Cell Types Database and for a growing number of single cell data resources of Brain Initiative Cell Census Network. Allows interactive exploration of cellular hierarchies, transcriptome wide gene expression and metadata of individual cells, and computation of differential statistics between cell selections or clusters, and across species. Integrates linkout to the UCSC genome browser for linked cross-omics, cross-species exploration between matched gene expression, chromatin state and DNA methylation data.
Access Cytosplore Viewer here:
https://viewer.cytosplore.org/
Described in paper by Hodge et al. 2019.
Leiden Computational Biology Center (https://www.lcbc.nl/), Leiden University Medical Center
NeMO Analytics (RRID:SCR_018164) NeMO Analytics (nemoanalytics.org) is a web-based suite of data visualization and analysis tools, focusing single-cell data analysis. The portal allows users to visualize published or user-supplied multi-omic data across experiments and species side-by-side. Tools include cluster visualization based on expression/cell type, cluster comparison, projection of one dataset into another, identification of marker genes, comparison of marker genes across datasets and note taking.
Access NeMO Analytics here:
https://nemoanalytics.org
BICCN publications landing page: here.
NeuroMorpho.org (RRID:SCR_002145). Centrally curated inventory of digitally reconstructed neurons and glia associated with peer-reviewed publications that contains some of the most complete axonal arborizations digitally available in the community. Each cell is represented by a unique identifier, general information (metadata), the original and standardized ASCII files of the digital morphological reconstruction, and a set of morphometric features. It contains contributions from over 800 laboratories worldwide and is continuously updated as new morphological reconstructions are collected, published, and shared. Users may browse by species, brain region, cell type or lab name. Users can also download morphological reconstructions for research and analysis. Deposition and distribution of reconstruction files ultimately prevents data loss. Centralized curation and annotation aim to minimize the effort required by data owners while ensuring a unified format. It also provides a one-stop entry point for all available reconstructions, thus maximizing data visibility and impact.
Access NeuroMorpho.org here:
http://www.neuromorpho.org
Ascoli Lab: https://krasnow1.gmu.edu/cn3/ascoli/

Single Cell Portal (RRID:SCR_014816). The Single Cell Portal specializes in visualizing and disseminating single-cell data. The Portal allows you to use natural language and faceted search to discover other scientists’ research and share your own findings. Each study can include information on cell types, singular or multiple gene expression, and spatial transcriptomics. In addition, interactive visualizations allow you to explore cell clusters and search for related genes. If you wish to explore further, you can download a study’s data. As a free and public resource, we strive to make open science interactive and powerful.
Access Single Cell Portal here:
https://singlecell.broadinstitute.org/single_cell
RRID: SCR_014816
Contact: scp-support@broadinstitute.zendesk.com

Anatomy and Morphology Molecular Portal (RRID:SCR_014816). The Anatomy and Morphology Project is a joint effort with the Brain Architecture Portal and the Single Cell Portal. Our goal is to visually combine anatomic and molecular brain data in. Users can search for neuroscience data using natural language and faceted search, and then this portal retrieves molecular data housed in the Single Cell Portal and anatomical data in the Brain Architecture Portal. Each study includes information on cell types, gene expression, related genes, and spatial transcriptomics. You can also download a study’s data to explore further and build on your science.
Access Anatomy and Morphology Molecular Portal here:
https://singlecell.broadinstitute.org/single_cell?scpbr=biccn-anatomy-and-morphology-project
RRID: SCR_014816
Contact: scp-support@broadinstitute.zendesk.com
Transcriptomics Explorer (RRID:SCR_017567). Software tool to visualize and analyze transcriptomics data and transcriptomic cell types for mouse and human, all directly in the web browser. Explore gene expression across cell types, search for genes of interest, explore tSNE and UMAPs, and visualize a dataset’s sampling strategy to see how cells and nuclei were sampled across brain areas, cortical layer, and other dimensions. Used for Allen Cell Types Database to Browse Data: Human - Multiple Cortical Areas and Mouse - Cortex and Hippocampus, as well as other datasets.
Access Transcriptomics Explorer here:
https://portal.brain-map.org/atlases-and-data/rnaseq
BICCN Pipelines
Overview
Pipeline Standards, Maintenance, and Availability
- Open-access and developed with GA4GH standards.
- Written in the Workflow Description Language (WDL), a community-maintained, human-readable workflow language that can run on Cromwell, a portable execution engine that can be launched anywhere, locally or in the cloud.
- Containerized using public Docker instances, allowing researchers to exactly reproduce the workflow software.
- Code is developed and maintained in the WDL Analysis Research Pipelines (WARP) repository in GitHub. Overviews and workflow code for BICCN-related pipelines are linked in the table above; additionally, relevant pipelines can be identified by typing the keyword “BICCN” in the WARP Documentation search bar.The WARP Overview details navigating the repository, pipeline development, and running the workflows.
- Workflows are available for export from Dockstore, a GA4GH-compliant platform for sharing Docker-based tools. Search “warp” on Dockstore to find all WARP pipelines, including those used in the BICCN.
- Workflows are also available to test on Terra, the cloud-based bioinformatics platform used for BCDC data processing. To get started, register for Terra using the registration guide. To try a pipeline, navigate to the pipeline’s workspace linked in the table above or search for the “BICCN” tag in the workspaces tag search bar. Each workspace contains downsampled data, detailed instructions for using the workflows, and cost guidelines. Learn more about Terra with the Getting Started guides.
Citing the Pipelines
Additional Single-cell Transcriptomic Pipeline Resources
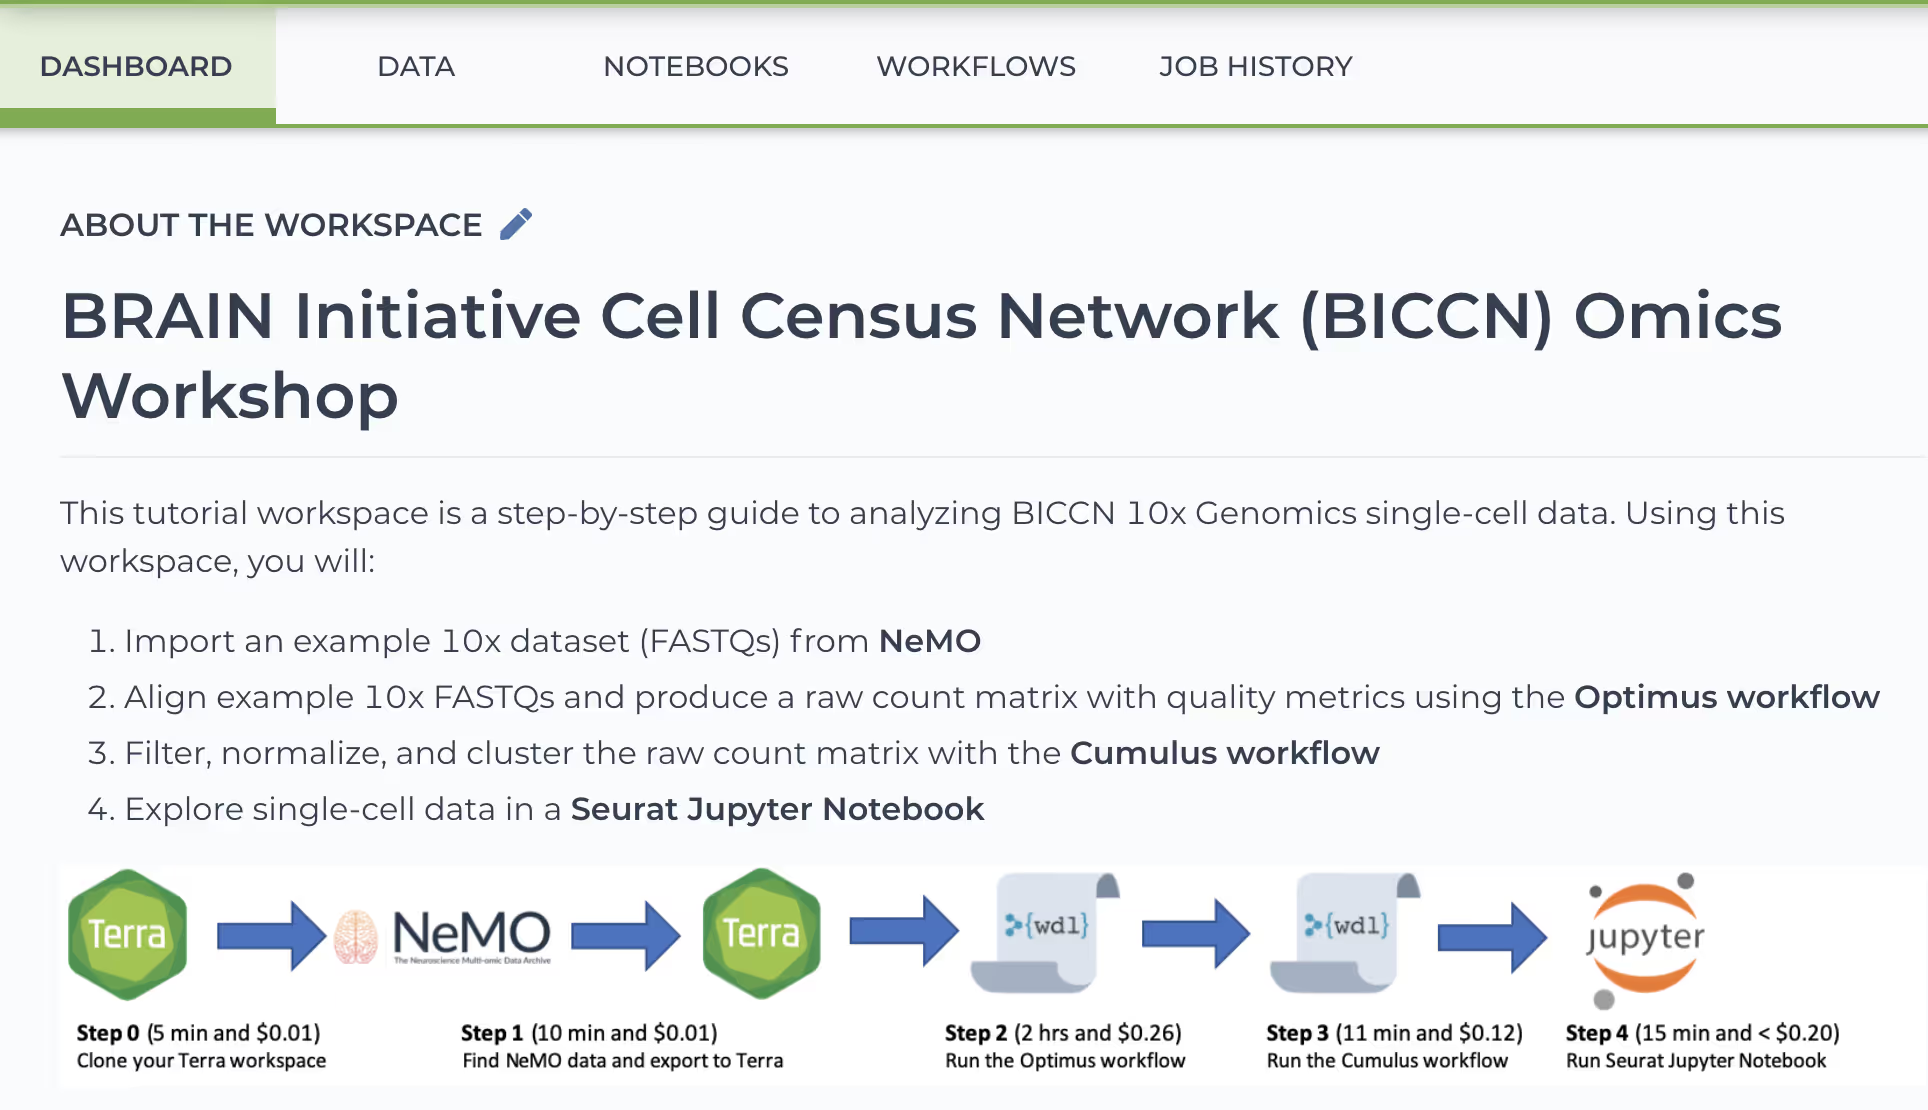
BICCN Omics Workshop Workspace
- Import an example 10x dataset (FASTQs) from NeMO
- Align example 10x FASTQs and produce a raw count matrix with quality metrics using the Optimus workflow
- Filter, normalize, and cluster the raw count matrix with the Cumulus workflow
- Explore single-cell data in a Seurat Jupyter Notebook
BICCN Omics Workshop Webinar Recording
BICCN Omics Workshop Blog
Acknowledgments
